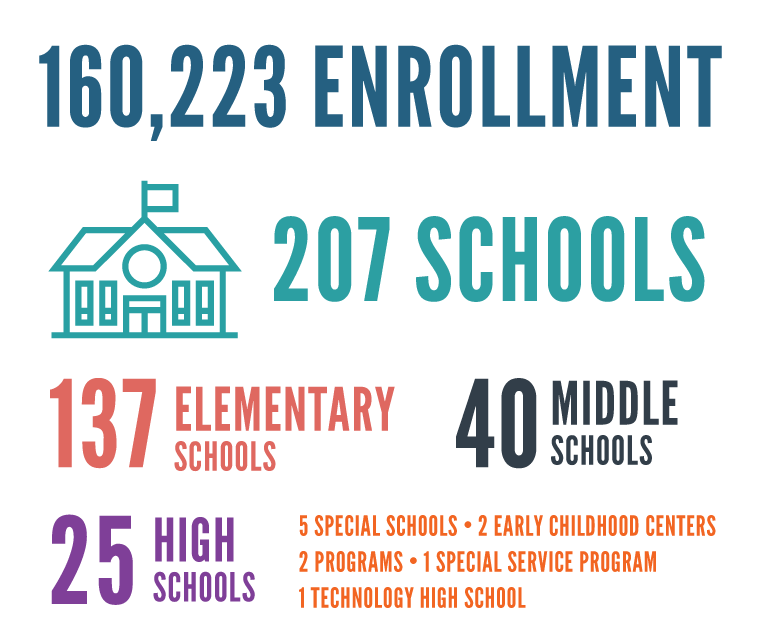
Our Schools 2023-2024
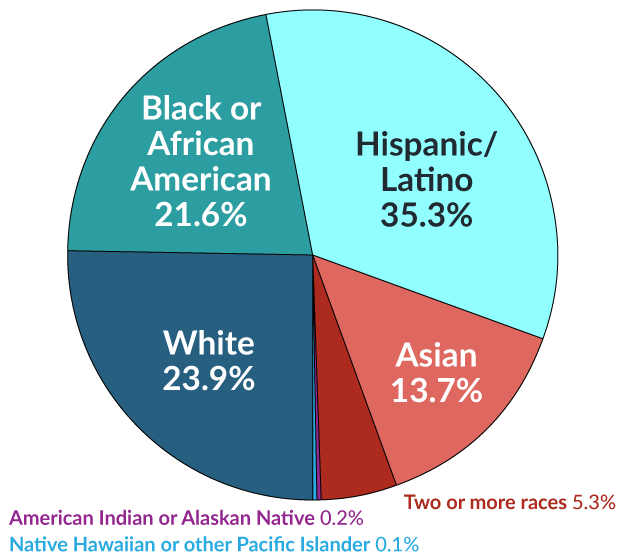
Student Demographics 2023-2024
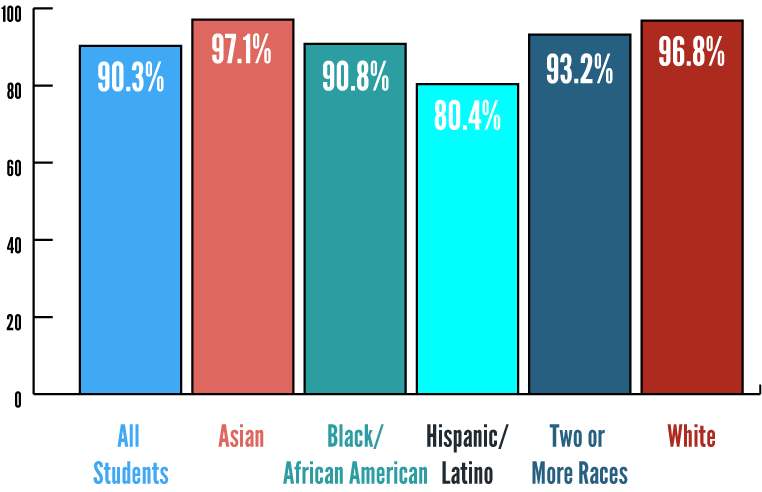
Graduation Rate 2022
2023 data coming in March 2024
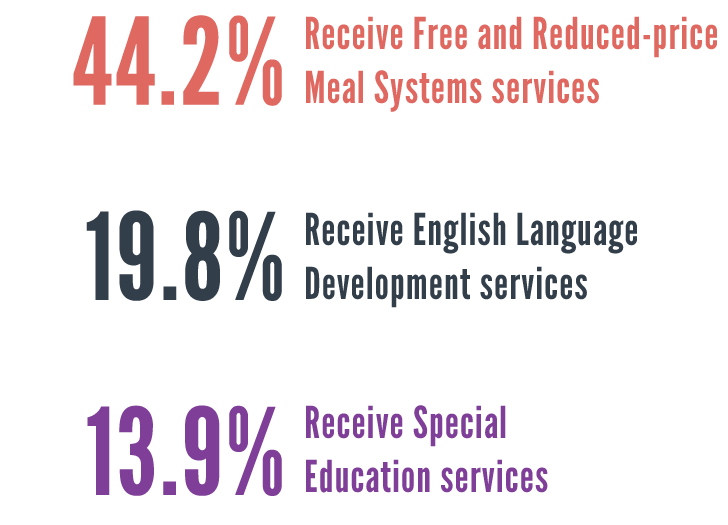
Services 2023-2024
Every four years, the Montgomery County Board of Education (BOE) establishes a strategic plan to guide the work of Montgomery County Public Schools (MCPS).
Below you will find the objectives, targets and strategies organized into the three priority areas:
Academic Excellence
MCPS is committed to preparing all students for success in college, career and community. To do this, we must provide robust coursework, career opportunities and early access to college credit so students can be successful, whatever their path may be. MCPS will ensure that student outcomes are not predictable by race, ethnicity, socioeconomic status or educational need.
Improve student achievement in literacy and mathematics
Objective
Improve student achievement in literacy and mathematics
Strategies Identified for 2024-2025
- Ensure equitable, grade-level instruction in literacy and math with systemwide professional learning and school-based coaching that is continuously evaluated and measured. Emphasis on: African American and Black students, Hispanic/Latino students, Emergent Multilingual Learners (EMLs), and students receiving special education.
- Monitor data for all students to determine progress, develop curricular resources, and plan for high-quality instruction. Emphasis on: African American and Black students, Hispanic/Latino students, Emergent Multilingual Learners (EMLs), and students receiving special education.
- Provide professional development and coaching to ensure all students are receiving differentiated instruction.
Metrics of Success
| Metrics of Success | Baseline (2020-2021) |
Year 1 ACTUAL (2021-2022) |
Year 2 TARGET (2022-2023) |
Year 2 ACTUAL (2022-2023) |
Year 3 TARGET(2023-2024) |
Year 3 ACTUAL(2023-2024) |
Year 4 TARGET (2024-2025) |
|---|---|---|---|---|---|---|---|
| % of students meeting Evidence of Learning Literacy | 57.9% | 71.7% | 73.9% | 73.4% | 81.9% | 69.5% | 90.0% |
| % of students meeting Evidence of Learning Mathematics | 55.4% | 61.2% | 72.7% | 61.3% | 81.4% | 60.7% | 90.0% |
| Equity Accountability Model: Academic Achievement Component Overall Score: Literacy Mathematics |
1.8 1.5 |
2.2 1.5 |
2.0 2.2 |
2.4 1.6 |
2.3 2.4 |
2.1 1.5 |
2.6 2.6 |
| Equity Accountability Model: Students With Disabilities Component Overall Score: Literacy Mathematics |
1.0 1.0 |
1.0 1.0 |
1.8 1.8 |
2.0 1.0 |
2.2 2.2 |
1.0 0 |
2.6 2.6 |
BOE Presentation
- BOE Business Meeting: December 5, 2023
- BOE Business Meeting: November 9, 2023
- BOE Business Meeting: October 26, 2023
- BOE Business Meeting: October 12, 2023
- BOE Business Meeting: September 21, 2023
- BOE Business Meeting: September 7, 2023
- BOE Business Meeting: August 24, 2023
- BOE Business Meeting: July 20, 2023
- BOE Business Meeting: April 20, 2023
- BOE Business Meeting: March 28, 2023
- Budget Work Session: Feb. 9, 2023
- BOE Business Meeting: Sept. 22, 2022
Increase the percentage of students graduating high school
Objective
Increase the percentage of students graduating high school
Strategies Identified for 2024-2025
- Monitor progress and plan transition for high school students nearing graduation. This will include check-in meetings with Grade 11 students who receive special education services and Emergent Multilingual Learners with or without international credits.
- Meet often with each senior to monitor student performance, plans and requirements towards graduation and post-secondary plans.
- Hold quarterly meetings with every high school’s administrative staff to monitor student graduation requirements. (Central Office team)
Metrics of Success
| Metrics of Success | Baseline (2020-2021) |
Year 1 ACTUAL (2021-2022) |
Year 2 TARGET (2022-2023) |
Year 2 ACTUAL (2022-2023) |
Year 3 TARGET(2023-2024) |
Year 3 ACTUAL(2023-2024) |
Year 4 TARGET (2024-2025) |
|---|---|---|---|---|---|---|---|
| Four-Year Graduation Rate | 89.3% | 90.3% (Class of 2022) |
92.13% | 89.6% (Class of 2023) |
93.57% | NYA |
95.0% |
| Five-Year Graduation Rate | 91.2% | 92.8% (Class of 2021) |
93.0% | 92.2% (Class of 2022) |
94.0% | NYA |
95.0% |
| Equity Accountability Model: Graduation Rate Component Overall Score | 2.8 | 2.4 | 3.0 | 2.6 | 3.0 | NYA |
3.0 |
BOE Presentation
Increase access to enriched and accelerated opportunities for underrepresented student groups
Objective
Increase access to enriched and accelerated opportunities for underrepresented student groups
Strategies Identified for 2024-2025
- Provide professional learning to staff through an antiracist lens to:
- Review and identify students for enriched and/or accelerated courses using multiple data points and criteria
- Monitor participation and progress of students in these courses
- Help with gifted and talented identification and articulation
- Ensure students with potential are given access to advanced coursework and pathways
- Meet the needs of students in accelerated and enriched courses
- Provide professional learning to the Title I funded Primary Talent Development Coaches to increase access to enrichment opportunities in grades K-2.
Metrics of Success
| Metrics of Success | Baseline (2020-2021) |
Year 1 ACTUAL (2021-2022) |
Year 2 TARGET (2022-2023) |
Year 2 ACTUAL (2022-2023) |
Year 3 TARGET(2023-2024) |
Year 3 ACTUAL (2023-2024) |
Year 4 TARGET (2024-2025) |
|---|---|---|---|---|---|---|---|
| Number of Students Invited to Enroll in Enriched and Accelerated Programs and Courses: Elementary Schools | FARMS = 235 Spec Ed = 48 ESOL = 21 |
170 35 125 |
265 54 23 |
201 28 34 |
280 57 24 |
322 59 65 |
294 60 26 |
| Number of Students Invited to Enroll in Enriched and Accelerated Programs and Courses: Middle Schools | FARMS = 70 Spec Ed = 12 ESOL = 8 |
184 33 177 |
80 14 ≤10 |
118 25 ≤10 |
85 15 10 |
86 ≤10 ≤10 |
88 15 10 |
| Number of Students Invited to Enroll in Enriched and Accelerated Programs and Courses: High Schools | FARMS = 164 Spec Ed = 23 ESOL = 21 |
163 32 24 |
184 27 23 |
154 16 ≤10 |
194 29 24 |
216 29 ≤10 |
205 29 26 |
*This data represents only students who are invited to centrally managed admission, criteria-based/lottery programs.
BOE Presentation
Increase Maryland College and Career Readiness Rates
Objective
Increase Maryland College and Career Readiness Rates
Strategies Identified for 2024-2025
- Increase support and professional learning to Algebra 1 teachers focusing on effective teaching strategies to meet the needs of diverse learners
- Engage parents and guardians by offering workshops and resources in multiple languages to help them support their children's education at home.
Metrics of Success
| Metrics of Success | Baseline (2020-2021) |
Year 1 ACTUAL (2021-2022) |
Year 2 TARGET (2022-2023) |
Year 2 ACTUAL (2022-2023) |
Year 3 TARGET(2023-2024) |
Year 3 ACTUAL (2023-2024) |
Year 4 TARGET (2024-2025) |
|---|---|---|---|---|---|---|---|
| Percent of Students Meeting Maryland College and Career Readiness Standards: Literacy and Mathematics | Literacy: 89.3% Mathematics: 81.2% |
85.6% 81.3% |
94.7% 90.6% |
53.2%* 10.2%* |
Targets will be recalculated when MSDE finalizes CCR measures | 45.5%** | Targets will be recalculated when MSDE finalizes CCR measures |
*The College and Career Readiness (CCR) results are based on interim measures calculated for Grade 10.
**MSDE updated CCR measures and literacy and mathematics are no longer calculated individually.
BOE Presentation
Improve completion rates to Career and Technical Education (CTE) programs
Objective
Improve completion rates to Career and Technical Education (CTE) programs
Strategies Identified for 2024-2025
- Increase CTE program access and completion rates for students who are Emergent Multilingual Learners, receive special education services, or are economically disadvantaged by:
- targeting outreach and family engagement,
- providing professional learning to CTE educators on best practices for supporting Emergent Multilingual Learners and Students with Disabilities in CTE courses, including how to implement students’ accommodations and modifications in instructional settings,
- monitoring course progression,
- expanding internship and dual enrollment capstone course opportunities, and
- increasing student support for academics and Industry Recognized Credentials (IRC).
- Boost enrollment in CTE programs by:
- increasing awareness and understanding of CTE pathways among middle school students, staff and families,
- engaging all 7th grade students in asynchronous CTE exploration lessons, and
- supporting high schools with articulation.
Metrics of Success
| Metrics of Success | Baseline (2020-2021) |
Year 1 ACTUAL (2021-2022) |
Year 2 TARGET (2022-2023) |
Year 2 ACTUAL (2022-2023) |
Year 3 TARGET(2023-2024) |
Year 3 ACTUAL (2023-2024) |
Year 4 TARGET (2024-2025) |
|---|---|---|---|---|---|---|---|
| Percent of High School Students with CTE Program Completion or Earning Industry-Recognized Credentials | 19.9% | 12.2% | 32.5% | 15.9% | 38.8% | 18.9% | 45.0% |
BOE Presentation
Increase postsecondary education enrollment
Objective
Increase postsecondary education enrollment
Strategies Identified for 2024-2025
- Provide high school students with opportunities to visit college campuses.
- Increase opportunities for students in Grades 8-12 to:
- participate in college and career fair opportunities
- use Naviance for college and career planning
- Expand dual-enrollment awareness to increase student exposure to postsecondary pathways.
Metrics of Success
| Metrics of Success | Baseline (2020-2021) |
Year 1 ACTUAL (2021-2022) |
Year 2 TARGET (2022-2023) |
Year 2 ACTUAL (2022-2023) |
Year 3 TARGET(2023-2024) |
Year 3 ACTUAL (2023-2024) |
Year 4 TARGET (2024-2025) |
|---|---|---|---|---|---|---|---|
| Percent of Graduating Class Enrolling in Postsecondary School 12 months post high school | 72.3% (Class of 2019) |
65.3% (Class of 2021) |
73.2% | 66.5% (Class of 2022) |
74.1% | 65.4% | 75% |
BOE Presentation
Increase career training opportunities for all students
Objective
Increase career training opportunities for all students
Strategies Identified for 2024-2025
- Use a new Work-based Learning Platform to expand student access to internships and other opportunities across the district.
- Develop districtwide work-based learning practices, systems, and processes to inform and support students in their application and apprenticeship experiences.
- Provide ongoing professional learning opportunities for internship coordinators and counselors to build capacity in curriculum implementation and community partnerships.
Metrics of Success
| Metrics of Success | Baseline (2020-2021) |
Year 1 ACTUAL (2021-2022) |
Year 2 TARGET (2022-2023) |
Year 2 ACTUAL (2022-2023) |
Year 3 TARGET(2023-2024) |
Year 3 ACTUAL (2023-2024) |
Year 4 TARGET (2024-2025) |
|---|---|---|---|---|---|---|---|
| Percent of Graduating Class Accessing Work-based Learning | 14.8% | 19% | 30% | 30% | 37.6% | 21% | 45% |
BOE Presentation
Well-Being and Family Engagement
Well-being and family engagement is an important part of student success. A critical component is supporting staff and students’ social-emotional needs so that everyone is thriving emotionally and academically. Just as important for success is MCPS' commitment to culturally responsive communication that provides all families the information, access and relationships needed to support their children.
Promote positive, caring, and supportive district and school climates respectful of students and staff
Objective
Promote positive, caring, and supportive district and school climates respectful of students and staff
Strategies Identified for 2024-2025
- Develop a mental health framework to assess, enhance, and track progress of related programs and services.
- Data-informed, integrated and districtwide
- MCPS will join a three-year cohort to drive this work in partnership with the Jed Foundation, a national nonprofit dedicated to protecting emotional health and preventing youth suicide
- Increase the number of Study Circle facilitators by training school-based staff. The Study Circles Program supports students, staff, and caregivers in developing the relationships, awareness, and skills necessary to engage in productive dialogue about challenging issues like racism and Hate-Bias.
- Give schools the resources and training they need to implement student well-being practices related to referrals, honoring humanity, root cause analysis, and targeted and documented interventions.
- Hold regular meetings about attendance data tracking, at both school and central office levels.
Metrics of Success
| Metrics of Success | Baseline (2020-2021) |
Year 1 ACTUAL (2021-2022) |
Year 2 TARGET (2022-2023) |
Year 2 ACTUAL (2022-2023) |
Year 3 TARGET(2023-2024) |
Year 3 ACTUAL (2023-2024) |
Year 4 TARGET (2024-2025) |
|---|---|---|---|---|---|---|---|
| Family, Student and Staff Feedback Surveys Response Rate | New | NYA | No Target Set | Staff: 40.3% Family: NYA Student: NYA |
NYA | Staff: 44.7% Family: 6.6% Students: 55.2% |
NYA |
| Percent Completion of District-Provided Training for Students and Staff to Promote a Positive School Culture: Students | 52% | 25% | 76% | 26% | 88% | 38.3% | 100% |
| Percent Completion of District-provided Training for Students and Staff to Promote a Positive School Culture: Staff | New | In Development | In Development | In Development | 13,770* | ||
District-provided Health and Wellness Programs for Students and Staff
|
New | 4,969 17,047 3,848 |
N/A 20,000 N/A |
4,197 21,883 3,015 |
N/A 23,000 N/A |
N/A 17,757 6,501 |
N/A 26,000 N/A |
*This is the number of participants in our mandatory districtwide professional learning days.
BOE Presentation
Implement school-level practices to support effective and efficient behavioral health management systems
Objective
Implement school-level practices to support effective and efficient behavioral health management systems
Strategies Identified for 2024-2025
- Develop skills and support for restorative justice coaches through Professional Learning Communities and extend training opportunities for other restorative practitioners, including well-being social workers, wellness coaches and community partners.
- Create and implement targeted action plans to address the disproportionality of suspensions of Black/African American students for focus schools. These will be co-led by a restorative justice instructional specialist and local restorative justice coaches and include:
- monthly team data analysis,
- walk-throughs with reflections,
- targeted professional development, and
- support meetings.
- Continue to use the Comprehensive Coordinated Early Intervening Services Grant (CCEIS) to review and address disproportionate suspensions of Black and Latino students with individualized education programs.
- Create two new groups to review suspension data, provide feedback to school leaders about actions taken (as measured by current state and district policies), and review policy/make recommendations for the Student Code of Conduct:
- Parent and community stakeholder committee
- Restorative Justice Student and Suspension Action Group
- Review every school’s incident and suspension data weekly and follow up with a response (Associate Superintendents, Directors, School-Based Leaders)
Metrics of Success
| Metrics of Success | Baseline (2020-2021) |
Year 1 ACTUAL (2021-2022) |
Year 2 TARGET (2022-2023) |
Year 2 ACTUAL (2022-2023) |
Year 3 TARGET(2023-2024) |
Year 3 ACTUAL (2023-2024) |
Year 4 TARGET (2024-2025) |
|---|---|---|---|---|---|---|---|
| Percent of Schools Implementing Restorative Practices | 20% | 67.4% | 60% | 90% | 80% | 98% | 100% |
| Percent of Schools Implementing Social-Emotional Curricula | New | 37.9% | 59% | 69% | 79% | N/A | 5% |
| Percent of Office Referrals for Disrespect, Disruption and Insubordination for Black or African American and Hispanic/Latino Students | 64.4% (2019-2020) |
78.3% | 59.6% | 76.3% | 54.8% | 78.9% | 50% |
| Percent of Out-of-School Suspensions for Disrespect, Disruption and Insubordination for Black or African American and Hispanic/Latino Students | 79.6% (2019-2020) |
83.1% | 69.7% | 76.8% | 59.8% | 95% | 50% |
BOE Presentation
Implement culturally responsive family engagement that promotes two-way communication and empowers families to be partners with MCPS
Objective
Implement culturally responsive family engagement that promotes two-way communication and empowers families to be partners with MCPS
Strategies Identified for 2024-2025
- Continue to train schools on the Antiracist and Culturally Responsive Family Engagement module for School Improvement.
- Deliver parent workshops based on the specific needs of school communities.
- Implement a tool to help schools make informed decisions around the adoption and usage of ParentVUE.
Metrics of Success
| Metrics of Success | Baseline (2020-2021) |
Year 1 ACTUAL (2021-2022) |
Year 2 TARGET (2022-2023) |
Year 2 ACTUAL (2022-2023) |
Year 3 TARGET(2023-2024) |
Year 3 ACTUAL (2023-2024) |
Year 4 TARGET (2024-2025) |
|---|---|---|---|---|---|---|---|
| Number of Family Workshops (i.e. Parent Academy, Study Circles) and Community Outreach Events | 67 | 75 | 73 | 69 (Parent Academy sessions) |
76 | 70- PA 56- CE 32- SC |
80 |
| Percent of Families with ParentVue Activations | 62% | 79% | 81% | 84.4% | 90.5% | 89.03% | 100% |
Innovative Communications Strategies Used to Reach Families
| New | Over 3,000 families reached; 24 pop-up events |
Over 5,000 families reached; 30 pop-up events |
Over 6,000 families reached; 30 pop-up events |
Over 7,000 families reached; 40 pop-up events |
Over 8,000 families reached; 21 pop-up events |
Over 8,000 families reached; 50 pop-up events |
BOE Presentation
Professional and Operational Excellence
Student success is only possible by hiring and maintaining a highly qualified, diverse and culturally proficient workforce. MCPS will use targeted recruitment strategies, teacher pathway programs for our supporting services staff and regular professional development to ensure we have the best educators. Our commitment to effective operations across the district allows schools to maintain their focus on student success. This includes direct support to schools and students’ equal access to resources, stable financial practices and a commitment to environmental protection.
Increase districtwide, culturally relevant professional learning for all staff to support equity and to increase capacity for teaching
Objective
Increase districtwide, culturally relevant professional learning for all staff to support equity and to increase capacity for teaching
Strategies Identified for 2024-2025
- Deliver mandatory training to all leaders and instructional specialists, with ongoing support focused on coherence, accountability, equity-centered capacity building, and building relational trust.
- Build on existing work with the equitable teaching and learning framework and supportive online tools that provide specific examples of the framework in action in MCPS schools.
Metrics of Success
| Metrics of Success | Baseline (2020-2021) |
Year 1 ACTUAL (2021-2022) |
Year 2 TARGET (2022-2023) |
Year 2 ACTUAL (2022-2023) |
Year 3 TARGET(2023-2024) |
Year 3 ACTUAL (2023-2024) |
Year 4 TARGET (2024-2025) |
|---|---|---|---|---|---|---|---|
| Number of Teachers and School Leaders Completing District Professional Development Focused on Instructional Strategies | 12,635 | 15,080 | 13,899 | 11,981 | 14,531 | 15,430 | 15,162 |
| Percent Completion of Professional Learning Courses Offered for New Teachers (New Teacher Training) | 92% | 82% | 96% | 83% | 98% | 86% | 100% |
| Staff Participating in Culturally Relevant Community Engagement Professional Development Opportunity in Identified Community Schools | New | 503 | 515 | 690 | 795 | 1,560 | 1,000 |
BOE Presentation
Increase professional learning opportunities for teachers and staff in trauma-informed practices to support students' social-emotional well-being
Objective
Increase professional learning opportunities for teachers and staff in trauma-informed practices to support students' social-emotional well-being
Strategies Identified for 2024-2025
- Implement existing Trauma-Informed Teaching asynchronous training.
- Develop additional Trauma-Informed training that focuses on Equity-Centered Trauma-Informed Teaching in collaboration with our external partners.
- Provide support, resources, and professional learning to school staff to foster a positive classroom environment. Topics will include Trauma-Informed Classrooms, Self-Care and Burnout Prevention, Verbal crisis de-escalation, Culturally Responsive Practices, or other topics upon agreement/need of the individual school.
Metrics of Success
| Metrics of Success | Baseline (2020-2021) |
Year 1 actual (2021-2022) |
Year 2 TARGET (2022-2023) |
Year 2 ACTUAL (2022-2023) |
Year 3 TARGET(2023-2024) |
Year 3 ACTUAL (2023-2024) |
Year 4 TARGET (2024-2025) |
|---|---|---|---|---|---|---|---|
| Number of Professional Development Courses Offered Focused on Trauma-Informed Practices | New | 2 | 3 | 2 | 4 | 2 | 3 |
| Number of Staff Completing Professional Development Courses Focused on Trauma-Informed Practices | New | 90 | 180 | 183 | 270 | 526 | 300 |
BOE Presentation
Improve the strategic recruitment strategy in order to increase high-quality workforce diversity
Objective
Improve the strategic recruitment strategy in order to increase high-quality workforce diversity
Strategies Identified for 2024-2025
- Train interns on equity, the application process, interviewing, and other topics.
- Collaborate and partner with our Professional Development Schools (PDS), Hispanic-Serving Institutions (HSI), and Historically Black Colleges and Universities (HBCU) to guide students entering education.
- Recruit eligible students and recent graduates through school-based career events for temporary part-time and permanent positions in MCPS. Expand to include student interns available to work during extended breaks.
Metrics of Success
| Metrics of Success | Baseline (2020-2021) |
Year 1 ACTUAL (2021-2022) |
Year 2 TARGET (2022-2023) |
Year 2 ACTUAL (2022-2023) |
Year 3 TARGET(2023-2024) |
Year 3 ACTUAL (2023-2024) |
Year 4 TARGET (2024-2025) |
|---|---|---|---|---|---|---|---|
| Job Fairs Attended for Recruitment of High-Quality and Diverse Candidates | 13 | 35 | 14 | 44 | 15 | 64 | 16 |
| Professional Workforce Diversity Rates American Indian or Alaskan Native |
0.2% 8.8% 18.4% 14.5% 0.1% 1.5% 56.4% |
0.2% 9% 18.4% 15.2% 0.1% 1.5% 55.7% |
N/A |
0.2% 9.5% 18.9% 16.3% 0.1% 1.4% 53.6% |
N/A |
0.1% 9.6% 19.4% 17.6% 0.1% 1.4% 51.7% |
N/A |
BOE Presentation
Improve connectivity and satisfaction with MCPS technology
Objective
Improve connectivity and satisfaction with MCPS technology
Updated Strategies for 2022-2023
- Implement ParentSquare to create a more connected communication infrastructure.
- Evaluate the current Learning Management System and make necessary adjustments based on feedback.
- Consolidate multiple technology platforms to better meet the needs of our community.
Metrics of Success
| Metrics of Success | Baseline (2020-2021) |
Year 1 ACTUAL (2021-2022) |
Year 2 TARGET (2022-2023) |
Year 2 ACTUAL (2022-2023) |
Year 3 TARGET(2023-2024) |
Year 3 ACTUAL (2023-2024) |
Year 4 TARGET (2024-2025) |
|---|---|---|---|---|---|---|---|
| Technology Survey on Applications and Platforms Used Across Schools | New | 68% | 75% | 83% | 82% | 87% | 90% |
| Staff, Student, and Family Surveys of Technology Use and Connectivity | New | 98% | 99% | 99.3% | 99.5% | 99% | 100% |
BOE Presentation
Improve the strategic recruitment strategy to support the social-emotional well-being of all students
Objective
Improve the strategic recruitment strategy to support the social-emotional well-being of all students
Strategies Identified for 2024-2025
- Partner with the following organizations on recruitment events targeting diverse mental health professionals:
- National Association of State Boards of Education (NASBE)
- National Association of School Psychologists (NASP)
- Hispanic-Serving Institutions (HSI)
- Historically Black Colleges and Universities (HBCUs).
- Collaborate with academic institutions that have mental health programs and serve minority communities to create internship and practicum placement opportunities. These programs may include: HSI, Asian American and Native American Pacific Islander-Serving Institutions (AANAPISI), and HBCUs.
- Advertise job openings on various platforms and job boards, such as NASP, the American School Counselor Association (ASCA), and the National Association of Social Workers (NASW).
Metrics of Success
| Metrics of Success | Baseline (2020-2021) |
Year 1 ACTUAL (2021-2022) |
Year 2 TARGET (2022-2023) |
Year 2 ACTUAL (2022-2023) |
Year 3 TARGET(2023-2024) |
Year 3 ACTUAL (2023-2024) |
Year 4 TARGET (2024-2025) |
|---|---|---|---|---|---|---|---|
| Job Fairs Attended for Recruitment of Psychologists and Counselors | New | 2 | 2 | 2 | 3 | 64* | 4 |
| Number of Psychologists and Counselors Hired | New | 70 (61 Counselors 9 Psychologists) |
N/A | 58 (51 Counselors 7 Psychologists) |
N/A | 70 (52 Counselors 18 Psychologists) |
N/A |
*This is the total # of job fairs attended for all staff, not specific to psychologists and counselors.
BOE Presentation
Connect the district’s financial plan to the strategic plan with the goal of aligning all district resources and increase transparency
Objective
Connect the district’s financial plan to the strategic plan with the goal of aligning all district resources and increase transparency
Strategies Identified for 2024-2025
- Develop and produce a program budget that aligns with key programs and the strategic plan.
- Develop a balanced budget that allows for the highest priority accelerators based on staff and stakeholder input.
- Launch a budget dashboard to provide increased clarity and understanding of budget allocations and resources.
- Align with Montgomery County Council’s new reporting requirements for MCPS to increase transparency and understanding of the MCPS Operating Budget.
Metrics of Success
| Metrics of Success | Baseline (2020-2021) |
Year 1 ACTUAL (2021-2022) |
Year 2 TARGET (2022-2023) |
Year 2 ACTUAL (2022-2023) |
Year 3 TARGET(2023-2024) |
Year 3 ACTUAL (2023-2024) |
Year 4 TARGET (2024-2025) |
|---|---|---|---|---|---|---|---|
| Total Number of Professional Development Courses Offered to Learning MCPS Business Hub (includes synchronous and asynchronous)* | New | 14 | 16 | 14 | 15 | 15 | 15 |
| Number of staff completing at least one professional development course to learn the MCPS Business Hub | New | 690 | 600 | 533 | 474 | 437 | 500 |
BOE Presentation
Continue to provide and maintain safe and clean facilities that ensure accessibility and support the learning environment
Objective
Continue to provide and maintain safe and clean facilities that ensure accessibility and support the learning environment
Strategies Identified for 2024-2025
- Expand the use and user group of Facilities Employee Resource Network (FERN) to represent all 4 Office of Facilities Management divisions.
- Design every construction project to maximize solar production potential and minimize energy-use intensity, considering a balanced facilities and infrastructure portfolio across the system.
- Grow workforce capacity by increasing the number of professional learning opportunities for all staff.
- Adhere to the steps outlined in the preventive maintenance plan.
- Coordinate and collaborate with administrators to develop Sustainability Action Plans at all schools.
- Recruit students and staff to engage in school-based actions to mitigate climate change.
Metrics of Success
| Metrics of Success | Baseline (2020-2021) |
Year 1 ACTUAL (2021-2022) |
Year 2 TARGET (2022-2023) |
Year 2 ACTUAL (2022-2023) |
Year 3 TARGET(2023-2024) |
Year 3 ACTUAL (2023-2024) |
Year 4 TARGET (2024-2025) |
|---|---|---|---|---|---|---|---|
| Percent of Received Maintenance Work Orders Completed | 96.1% | 83.2% | 97.9% | 93.81% | 98.8% | 92% | 95% |
| Percent of Buildings Meeting 'Adequate Rating' on State Assessment | 86% | 94.6% | 93% | 95.5% | 96.5% | 68.4% | 86% |
| Percent of Schools and Offices Completing Emergency Preparedness Activities | 25.8% (Schools Only: 2019-2020) |
88.7% | 63% | 92% | 81.6% | 97% | 100% |
| Number of Maryland Green Schools | 86 | 91 | 106 | 96 | 106 | 101 | 106 |
| Percent of schools submitting their Sustainability Action Plan | COVID Year | 77% | 100% | 77% | 100% | 87% | 100% |
| Systemwide Recycling Rate | COVID Year | 69% | 70% | 73% | 70% | 70% | 70% |
| Median Energy Use Intensity for Schools (calendar year) | COVID Year | COVID Year | 48.5 | 51.6 | 48.5 | 49.1 | 48.5 |
BOE Presentation
Increase experienced and diverse principals and teachers serving in high-need schools
Objective
Increase experienced and diverse principals and teachers serving in high-need schools
Strategies Identified for 2024-2025
- Implement the ALAS/MCPS partnership.
- 14 MCPS administrators will join the Association of Latino Administrators and Superintendents (ALAS) National Principal Academy (NPLA).
- ALAS-NPLA supports the development of aspiring and novice principals to address the needs of historically marginalized students and students of color.
- ALAS will include Hispanic/Latino and Asian educational leaders.
- Attract aspiring and experienced administrators of color to highly impacted schools with incentive plans and by hosting regular meet-and-greets and information sessions.
- Increase our principal pipeline by partnering with local and national affinity groups and organizations that support diverse educators.
- Provide job-embedded support and coaching for principals and teachers after they are hired.
Metrics of Success
| Metrics of Success | Baseline (2020-2021) |
Year 1 ACTUAL (2021-2022) |
Year 2 TARGET (2022-2023) |
Year 2 ACTUAL (2022-2023) |
Year 3 TARGET(2023-2024) |
Year 3 ACTUAL (2023-2024) |
Year 4 TARGET (2024-2025) |
|---|---|---|---|---|---|---|---|
| Percentage of experienced principals in high-needs schools | New | ES: 60% MS: 60% HS: 64% |
ES: 65% MS: 65% HS: 70% |
ES: 83% MS: 57% HS: 79% |
ES: 70% MS: 70% HS: 76% |
ES: 78.5% MS: 50% HS: 42.8% |
ES: 75% MS: 75% HS: 82% |
| Percentage of experienced teachers in high-needs schools | New | ES: 80% MS: 76% HS: 84% |
ES: 85% MS: 81% HS: 91% |
ES: 89% MS: 84% HS: 92% |
ES: 90% MS: 86% HS: 96% |
ES: 88.8% MS: 84.1% HS: 93.3% |
ES: 95% MS: 91% HS: 96% |
| Number of principals and teachers that received job-embedded support | New | 38 principals 627 teachers |
No Target Set | 39 principals 639 teachers |
No Target Set | 37 principals 693 teachers |
No Target Set |
*Experienced is defined as having 3+ years working as a principal or teacher.